Just by adjusting light temperature, music tempo, and aisle layout, retailers use sensory design to influence your buying decisions, subtly steering where you look and what you pick. Strategic lighting and slow melodies can lengthen your visit and increase your average basket size, while cluttered displays or harsh lights can overwhelm or mislead you. Understanding these cues helps you shop more deliberately and spot when the environment is nudging your choices.
Key Takeaways:
- Lighting that combines warm, focused accents on fresh items with softer ambient light increases perceived product quality and encourages longer browsing, raising purchase likelihood.
- Music tempo and volume shape shopping pace-slower, lower-volume tracks lengthen dwell time and boost basket size, while fast, loud music speeds throughput.
- Store layout that maximizes sightlines, creates a purposeful path, and places high-margin or impulse items at eye level and near checkouts increases time in store and average spend.
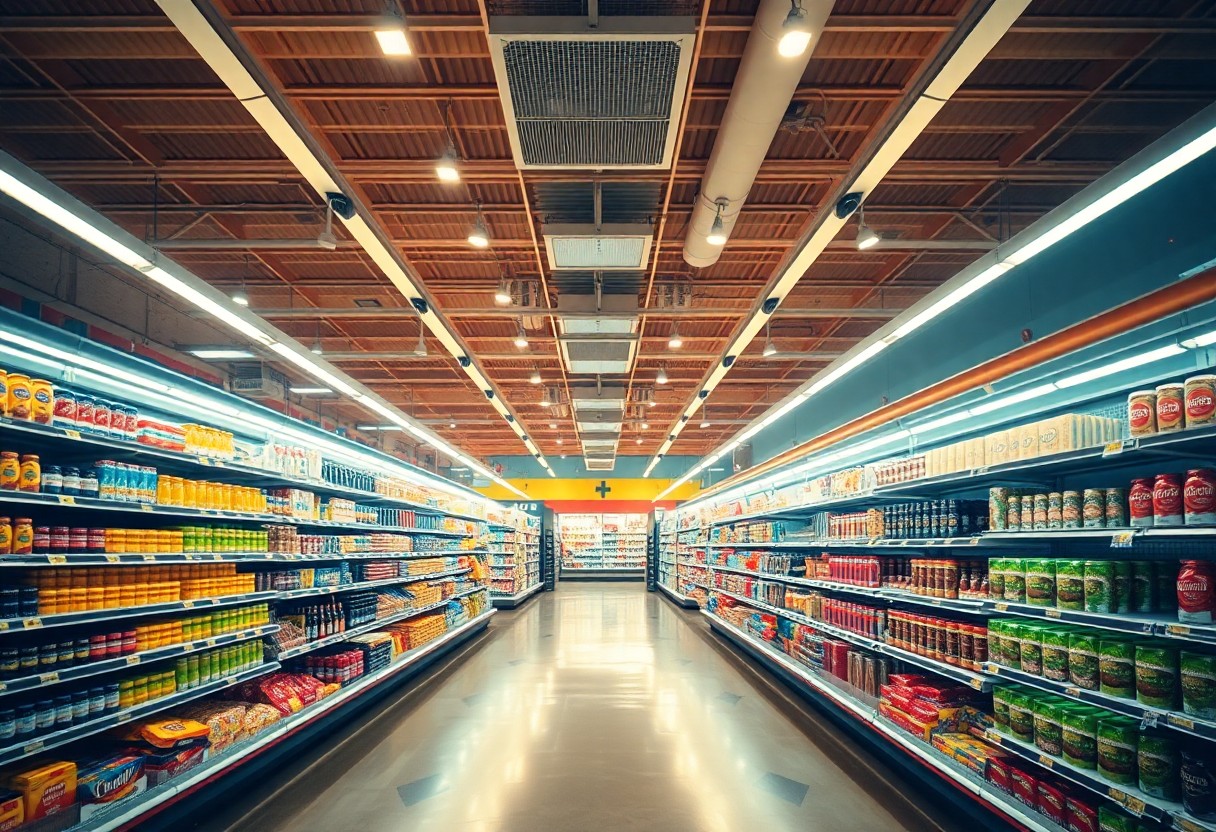
Lighting: Visual Psychology and Merchandising
You move differently under tailored lighting: warm, brighter entryways slow your pace and can increase dwell time by up to 20%, while targeted highlights nudge you toward impulse buys and can raise average basket size by 10-15%. Retailers exploit contrast and focal cues-see community examples at Psychological tricks used by supermarkets to get you …-to steer you to high‑margin SKUs.
How brightness, color temperature, and contrast shape perception and attention
You notice freshness and value faster when lighting matches category needs: higher lux and neutral‑cool temperatures make produce appear crisper, while warmer tones boost bakery appeal; contrast guides your eye to promotions and can increase conversion on highlighted SKUs by 10-20%.
Lighting factors and practical effects
| Variable | Effect / Recommendation |
|---|---|
| Brightness (lux) | General 300-500 lx; produce/display 500-1,000 lx → higher perceived freshness |
| Color temperature (K) | 2,700-3,500K warms baked goods; 3,500-4,500K neutral to cool for produce/meat |
| Contrast | Higher contrast ratios (≥3:1) on endcaps/promos direct attention and increase add‑on rates |
Spotlighting, shelf illumination, and visual hierarchy to drive purchase intent
You gravitate to items that are spotlighted: accent lighting and shelf uplights create a visual hierarchy that can boost attention by ~25-30% and raise sales of promoted items by around 15%, especially on endcaps and checkout displays.
You benefit from layered lighting: aisle ambient for comfort, shelf‑directed LEDs for clarity, and narrow‑beam spotlights for hero SKUs. Edge‑lit shelves increase visibility of packaging while backlighting enhances translucence (e.g., beverages). Avoid flicker and mismatched color casts-excessively harsh or unstable lighting fatigues shoppers and reduces time in store, cutting potential uplift.
Music: Auditory Atmosphere and Shopper Pace
Tempo, genre, and volume effects on walking speed, mood, and dwell time
Varying tempo directly shifts how quickly you move: slow tracks (60-80 BPM) can reduce walking speed by about 10-20%, increasing dwell time and basket size, while >120 BPM tends to speed shoppers up. Genre steers mood-classical or soft jazz calms, pop energizes-and a classic wine-shop study showed genre swaps alter category choice. Keep background volume around 60-70 dB; levels above 85 dB typically shorten visits and raise stress.
Zonal music strategies and demographic targeting for category-specific uplift
You should map playlists to zones: gentle acoustic or classical in produce and bakery to encourage lingering, upbeat pop near grab-and-go or ready-to-eat to increase turnover, and nostalgia or easy-listening in senior-heavy aisles to match preferences. Targeted audio can lift category sales; pilots often report 5-15% uplifts when music aligns with shopper demographics and product types, and you must avoid mismatches that reduce conversion.
Implement zonal tactics by syncing playlists to your shopper data and time of day: mornings with older cohorts get subdued tempos, evenings with younger crowds get current hits at moderate volume. Run A/B tests for 2-4 weeks per zone, measure dwell time with sensors and sales per SKU, and iterate-successful rollouts combine BPM, genre, and schedule to deliver consistent 3-10% category gains while avoiding overexposure.
Layout: Flow, Sightlines, and Behavioral Cues
Store entry dynamics, right-turn bias, and path design to maximize exposure
Placing fresh produce or the bakery to the right leverages the 60-70% right-turn bias many shoppers show on entry, immediately shaping perception and pace. You can use a clockwise “racetrack” or forced-path layout to shepherd customers past premium and promotional zones; putting staples like milk and bread at the back forces traversal and increases unplanned purchases. Loop and directed-path designs typically boost dwell time and exposure, often producing a 10-30% lift in average basket size.
Aisle configuration, focal points, and impulse zones to increase basket size
You should size aisles and sightlines to control speed and visibility: primary aisles at 10-12 ft invite browsing while secondary aisles at 4-6 ft balance reach and flow. Endcaps and gondola ends serve as high-impact focal points-endcaps can drive 20-30% of category sales when paired with cross-merchandising and clear signage. Checkout and near-register impulse zones, enhanced by targeted lighting and compact displays, reliably increase add-on purchases and transaction value.
Heat-mapping and path-tracking show you where to cluster promos: place attention-grabbing displays at mid-aisle intersections and within 3-4 ft of gondola ends to catch peripheral vision. Set eye-level planograms at ~48-60 inches for premium SKUs and slot multi-packs lower to encourage bulk buys. Avoid aisles under 3 ft, which create congestion and safety hazards; instead keep main sightlines open and use lighting to spotlight focal points. Combining these tactics with analytics-driven planograms commonly yields consistent double-digit uplifts in add-on rates and overall basket size.
Multisensory Integration and Crossmodal Effects
When you layer lighting, music, scent, and tactile cues, they don’t just add up-they interact to change how shoppers perceive price, freshness, and value. For example, warm, slightly dimmed lighting with soft music and a citrus note can make produce appear fresher and increase dwell time, with retailers reporting double-digit lifts in time-in-store and modest upticks in average basket size after coordinated rollouts. Mismatched cues, however, can erode trust and shorten visits.
Interactions among lighting, sound, scent, and touch that alter perception
Lighting affects color contrast and perceived freshness, music tempo controls walking speed, scent cues trigger category associations, and touch (pack weight, texture) shifts perceived quality; combined effects can amplify purchase intent. You can slow music to 60-80 BPM to increase linger time by roughly 15-20%, while brighter, cooler light makes dairy and seafood look more appealing. Use these crossmodal links to nudge attention and expand your average basket.
Consistency and congruence: aligning sensory cues with brand and expectations
Aligning sensory signals with your brand voice makes shoppers more comfortable and more likely to spend: a premium grocer pairing warm 3000-3500K lighting, mellow jazz, and a subtle bakery scent signals quality and can boost basket value, while a discounter uses bright, efficient lighting and brisk tempo to speed throughput. Consistency builds expectation and increases conversion; inconsistency creates cognitive dissonance that reduces time and spend.
To operationalize this, you should run a sensory audit, create a brand sensory profile, and A/B test changes for 2-4 weeks while tracking dwell time, items per trip, and average basket size. Practical settings: aim for 3000-4000K in ambient zones, 60-80 BPM for lingering playlists, and scent concentrations low enough to be noticeable but not overpowering. Prioritize test-and-measure-overpowering scent or loud music can cut visit length and sales.
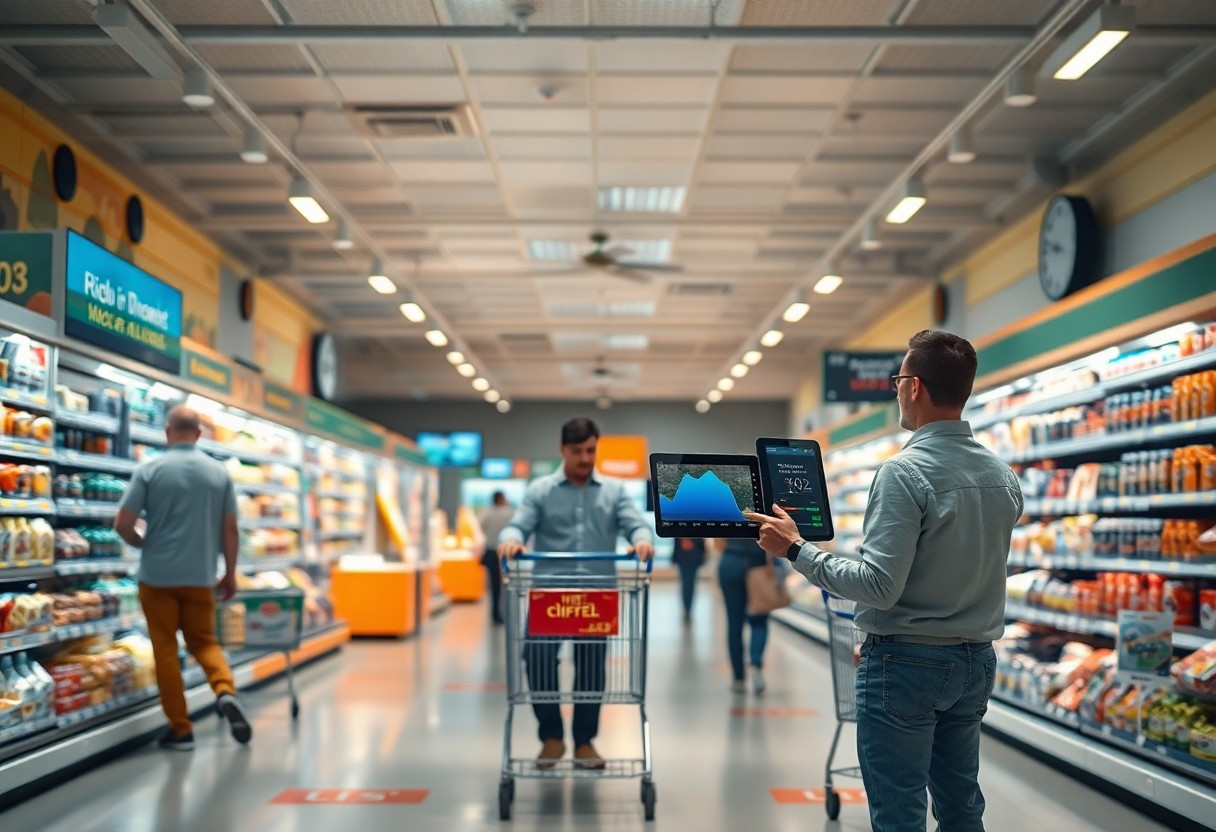
Measuring Impact: Time in Store, Dwell Patterns, and Basket Size
You link sensor streams to receipts to quantify behavior: Wi‑Fi/BLE footfall, video heatmaps, and POS give you dwell time, path density, and spend per visit. Correlations often show that increased dwell correlates with higher spend-typical A/B tests report 5-15% lifts in basket size for meaningful dwell increases-so you should prioritize tight data joins, sample sizes in the thousands, and daily aggregation to detect effects against noise.
Key metrics, observational methods, and experimental designs (A/B tests)
Track metrics like average dwell (minutes), path length (meters), conversion rate, items per trip, and spend per visit, using video analytics, Wi‑Fi/BLE, RFID, and POS linkage. Run store-level A/B tests by randomizing music tempo, lighting color, or aisle layout across matched pairs for 2-6 weeks, targeting statistical significance (p<0.05) and power >80%; you should also predefine minimum detectable effect (often 3-5%).
Common confounds, attribution challenges, and data-driven interpretation
Seasonality, concurrent promotions, staffing levels, queue times, and weather frequently confound your results and can inflate dwell or spend unrelated to sensory changes. Use control stores and time-series adjustments because promotions often mimic the same effect as lighting or scent, making naive attribution to sensory design risky unless you isolate those factors.
Mitigate confounds by triangulating sources: use matched‑pair controls or synthetic controls, implement staggered rollouts, and fit mixed‑effects or difference‑in‑differences models to control for store and time fixed effects. Run sensitivity analyses across segments and lags; for example, a 30‑store matched‑pair rollout found a 3% net lift in spend from lighting tweaks only after adjusting for promotion windows, underscoring the value of matched‑pair controls, mixed‑effects models, and robustness checks.
Practical Design Principles and Implementation Strategies
Focus on measurable sensory levers: lighting color temperature, music tempo/volume, and intentional aisle flow. You can expect interventions to affect dwell time and basket size-industry pilots typically target a 10-20% uplift in one KPI and measure over 4-8 weeks. Use controlled A/B layouts and track POS and pathing data; for example, warmer 3,000-3,500K produce lighting plus slower music often increases fresh-produce sales and time spent near displays.
Low-cost interventions, pilot testing, and scaling decisions
Start with affordable changes: LED dimming, curated 60-80 bpm playlists, endcap remerchandising, and wayfinding signs. Run 4-8 week pilots in one high-traffic store or 5-10% of your estate, monitor dwell time, conversion rate, and average basket value, and require statistical significance (p<0.05) before scaling. If pilots show double-digit gains, scale in phases with standardized playbooks to limit variability and accelerate ROI.
Operational considerations: staff, energy, regulations, and maintenance
You must align staff duties, energy budgets, and compliance early: LED retrofits typically cut lighting energy by 40-70%, but require supplier warranties, dimming controls, and updated maintenance schedules. Train your teams on playlist management and simple fixture checks, and verify local electrical and signage codes before rollout to avoid fines or shutdowns. Track maintenance logs and set SLAs with vendors to keep sensory systems consistent across stores.
Expand operations planning by integrating sensor analytics, preventive maintenance, and ROI tracking: deploy occupancy sensors and smart controls to save an additional 20-30% of lighting energy, maintain an asset register for fixtures with replacement intervals (LEDs often last 5-10 years), and train floor staff on basic troubleshooting to reduce vendor callouts. Ensure electrical permits, photobiological safety (flicker/UV limits), and music licensing are in place; noncompliance can cause fines or forced downtime, while well-managed programs often pay back within 12-36 months depending on scale and rebates.
To wrap up
Conclusively, understanding how lighting, music, and layout shape sensory design helps you influence shopper behavior, extend time in store, and increase average basket size; you can apply principles from studies like The Psychology of Product Displays: Why Shoppers Buy … to optimize flow, highlight high-margin items, and create atmospheres that guide your decisions.
FAQ
Q: How does lighting influence shopper behavior and purchasing decisions?
A: Lighting directs attention, shapes perceived product quality, and sets mood. Ambient lighting establishes overall comfort while accent and task lighting highlight displays and create visual hierarchy; produce and baked goods benefit from warmer, directional light that signals freshness, while bright, neutral lighting enhances clarity in packaged goods aisles. Contrast and spotlights steer the eye to promotions and high-margin items, increasing impulse picks; consistent, glare-free illumination shortens search time and encourages longer browsing, which typically raises average basket size.
Q: How does in-store music affect time spent in store and average spend?
A: Music alters pacing and emotional tone. Slower tempos and softer volumes encourage lingering and more exploratory behavior, often increasing dwell time and incidental purchases; faster tempos and louder music speed shopping and reduce time on task. Genre and familiarity must match the store’s brand and target demographic-congruent playlists boost perceived value and comfort, while mismatched music can shorten visits. Strategic scheduling (e.g., mellow morning playlists, upbeat afternoons) and zone-specific tracks (calmer in fresh departments, livelier near checkout) help optimize basket size.
Q: How do layout and multisensory design steer customer flow and grow basket size?
A: Layout determines exposure and ease of navigation. Loop or racetrack plans maximize aisle exposure, while grid layouts prioritize efficiency for quick trips; placing staples toward the back pulls traffic past multiple categories. Cross-merchandising, endcaps, clear sightlines, and sampling stations increase unplanned purchases. Integrating lighting, music, and scent creates a coherent sensory environment that encourages exploration; testing through heatmaps, dwell-time tracking, and A/B layout experiments reveals which configurations most effectively increase time in store and average basket value.